
The operating system for modern factories
Manufacturing intelligence, from one line to every plant
Connect every machine. Capture every event. Scale production intelligence across the enterprise — without a system overhaul.
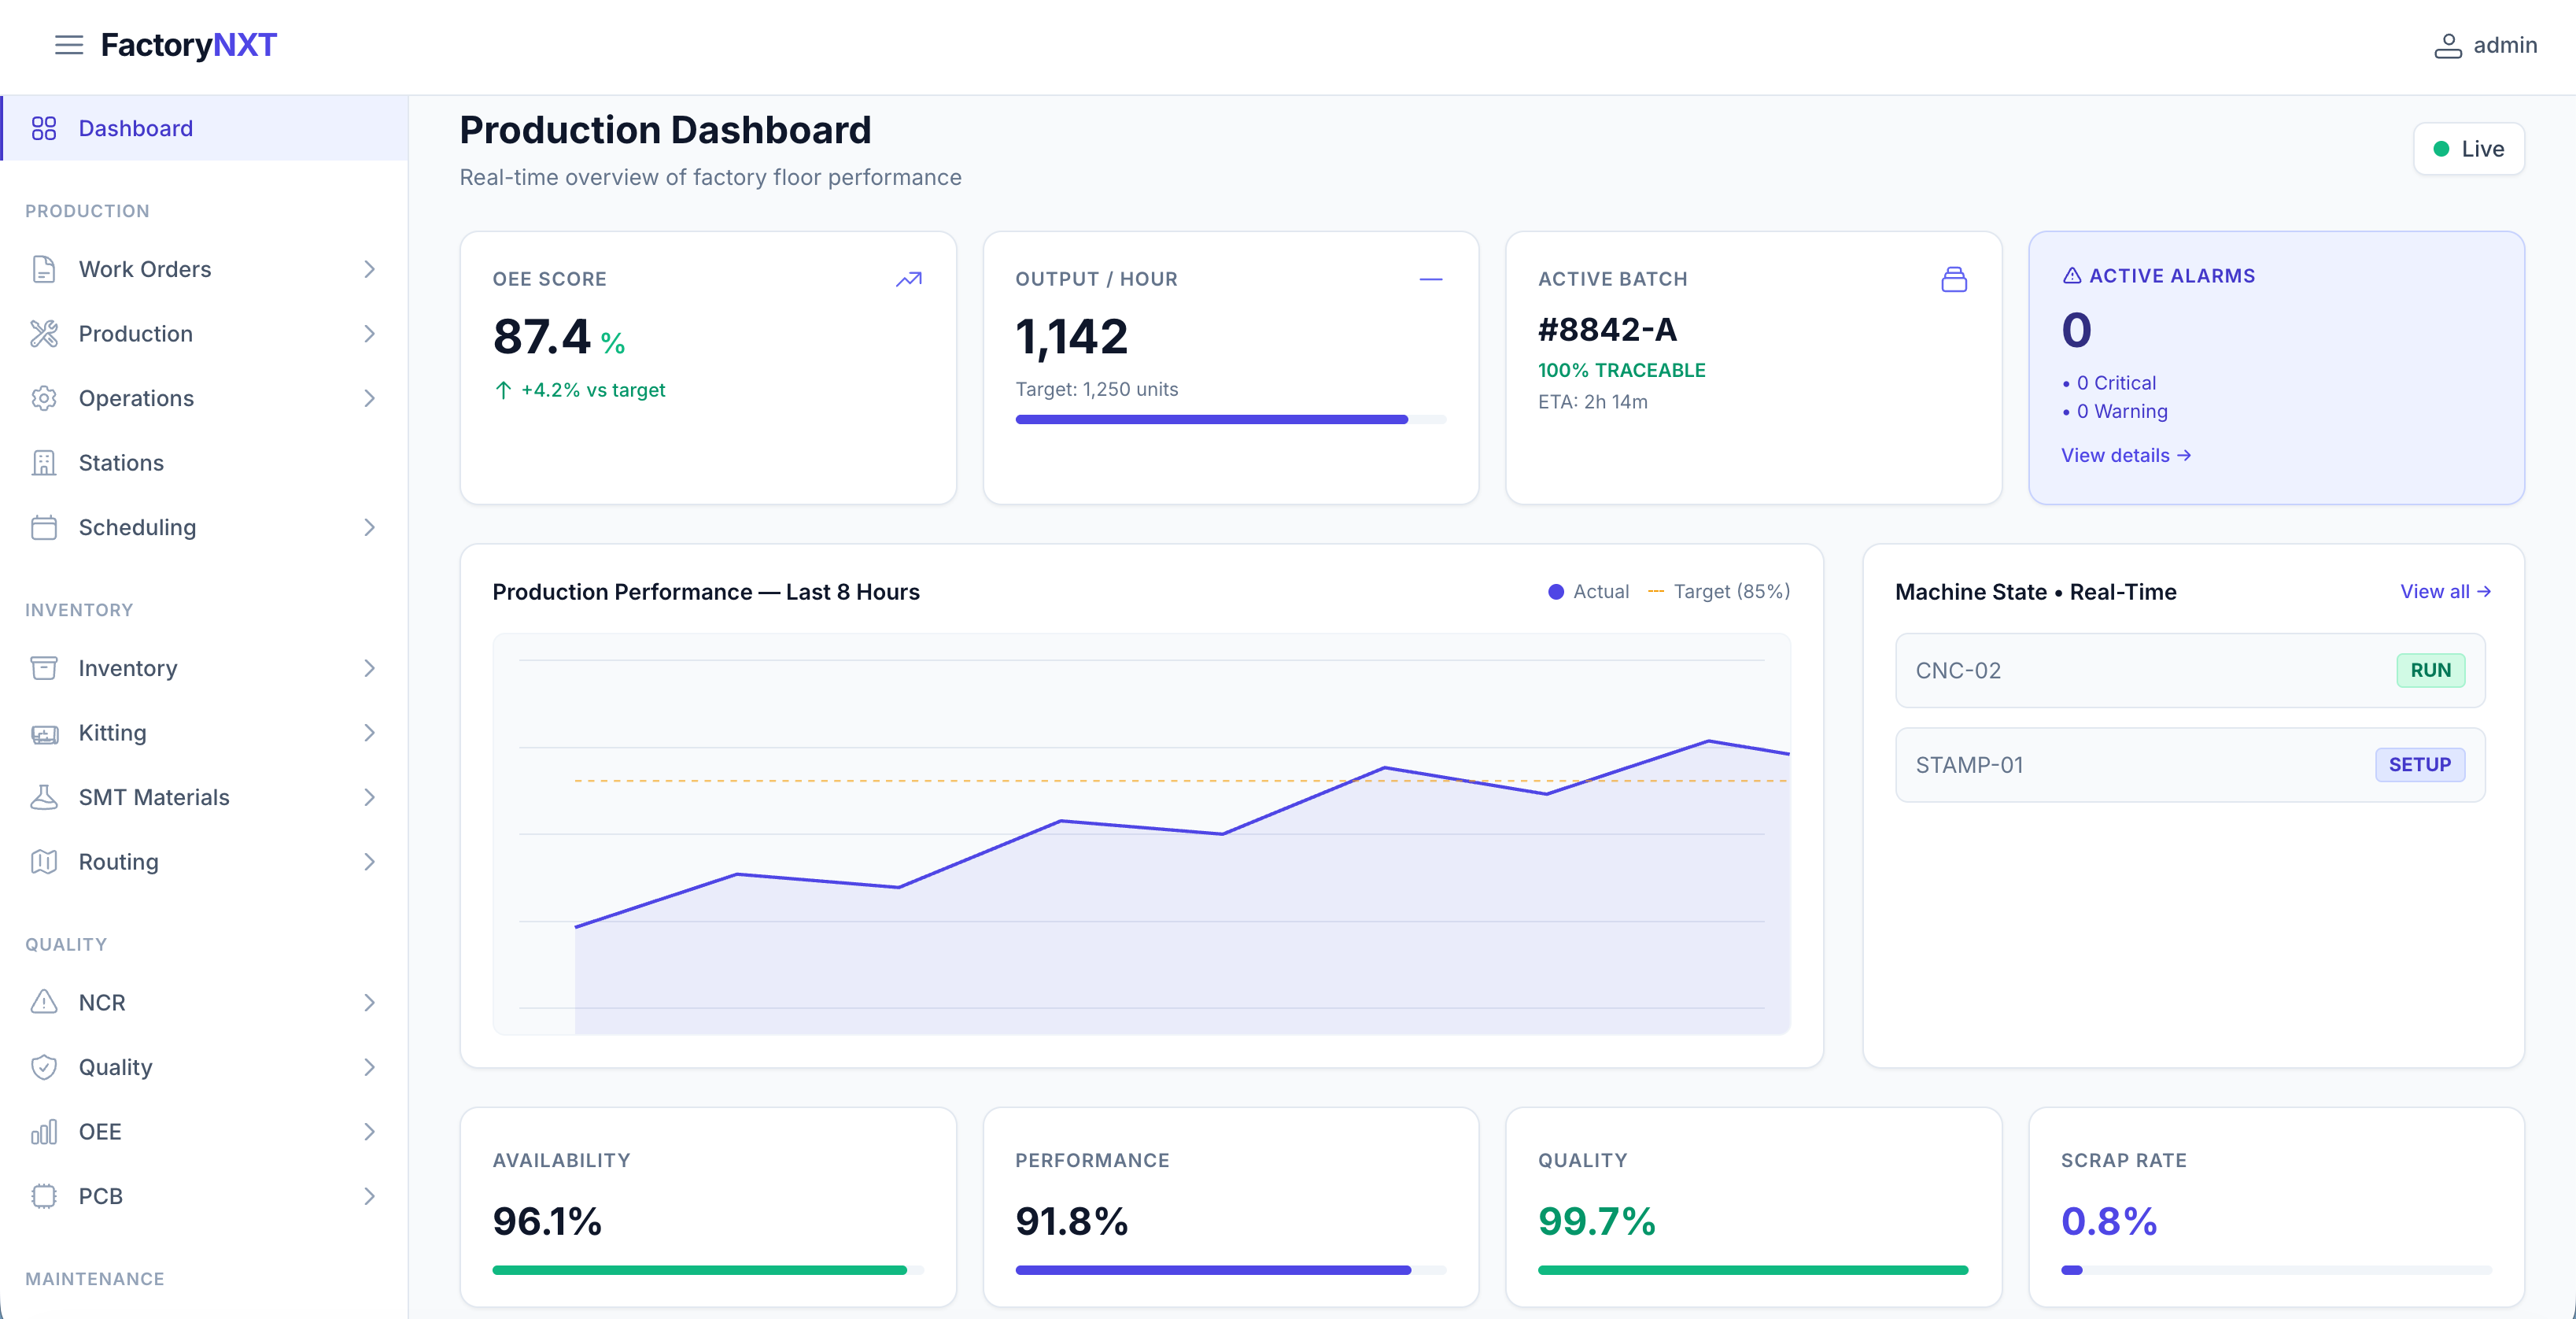
Explore the platformFactoryNXT is the manufacturing platform that connects machines, people, and systems. MES, SCADA integration, traceability, and OEE analytics in one coherent layer — built for the realities of the plant floor.
Built by engineers who understand ladder logic, ERP constraints, and the pressure of a Friday afternoon production meeting. We don't ship features that look good in a demo but fail on Line 04.
Integrates with the systems your factory already runs on
A modular platform for every layer of production
Deploy the modules you need, when you need them. Every component is purpose-built for the factory floor.
Manufacturing Execution System
Replace paper with a deterministic execution layer. Dispatch work orders, enforce digital work instructions, capture operator inputs, and track every step against recipe specs — in real time.
- Digital work orders with electronic sign-off
- Version-controlled recipe governance
- Real-time material lot consumption
Built for complex, regulated, high-volume plants
Purpose-built configurations for operations where traceability, uptime, and compliance aren't negotiable.
Discrete manufacturing
High-mix, low-volume production with tight scheduling and fast changeover requirements.
Interfaces built for the factory floor
High-contrast, touch-optimized, operator-first UIs. Designed to be readable from 50 feet away in the most demanding conditions.
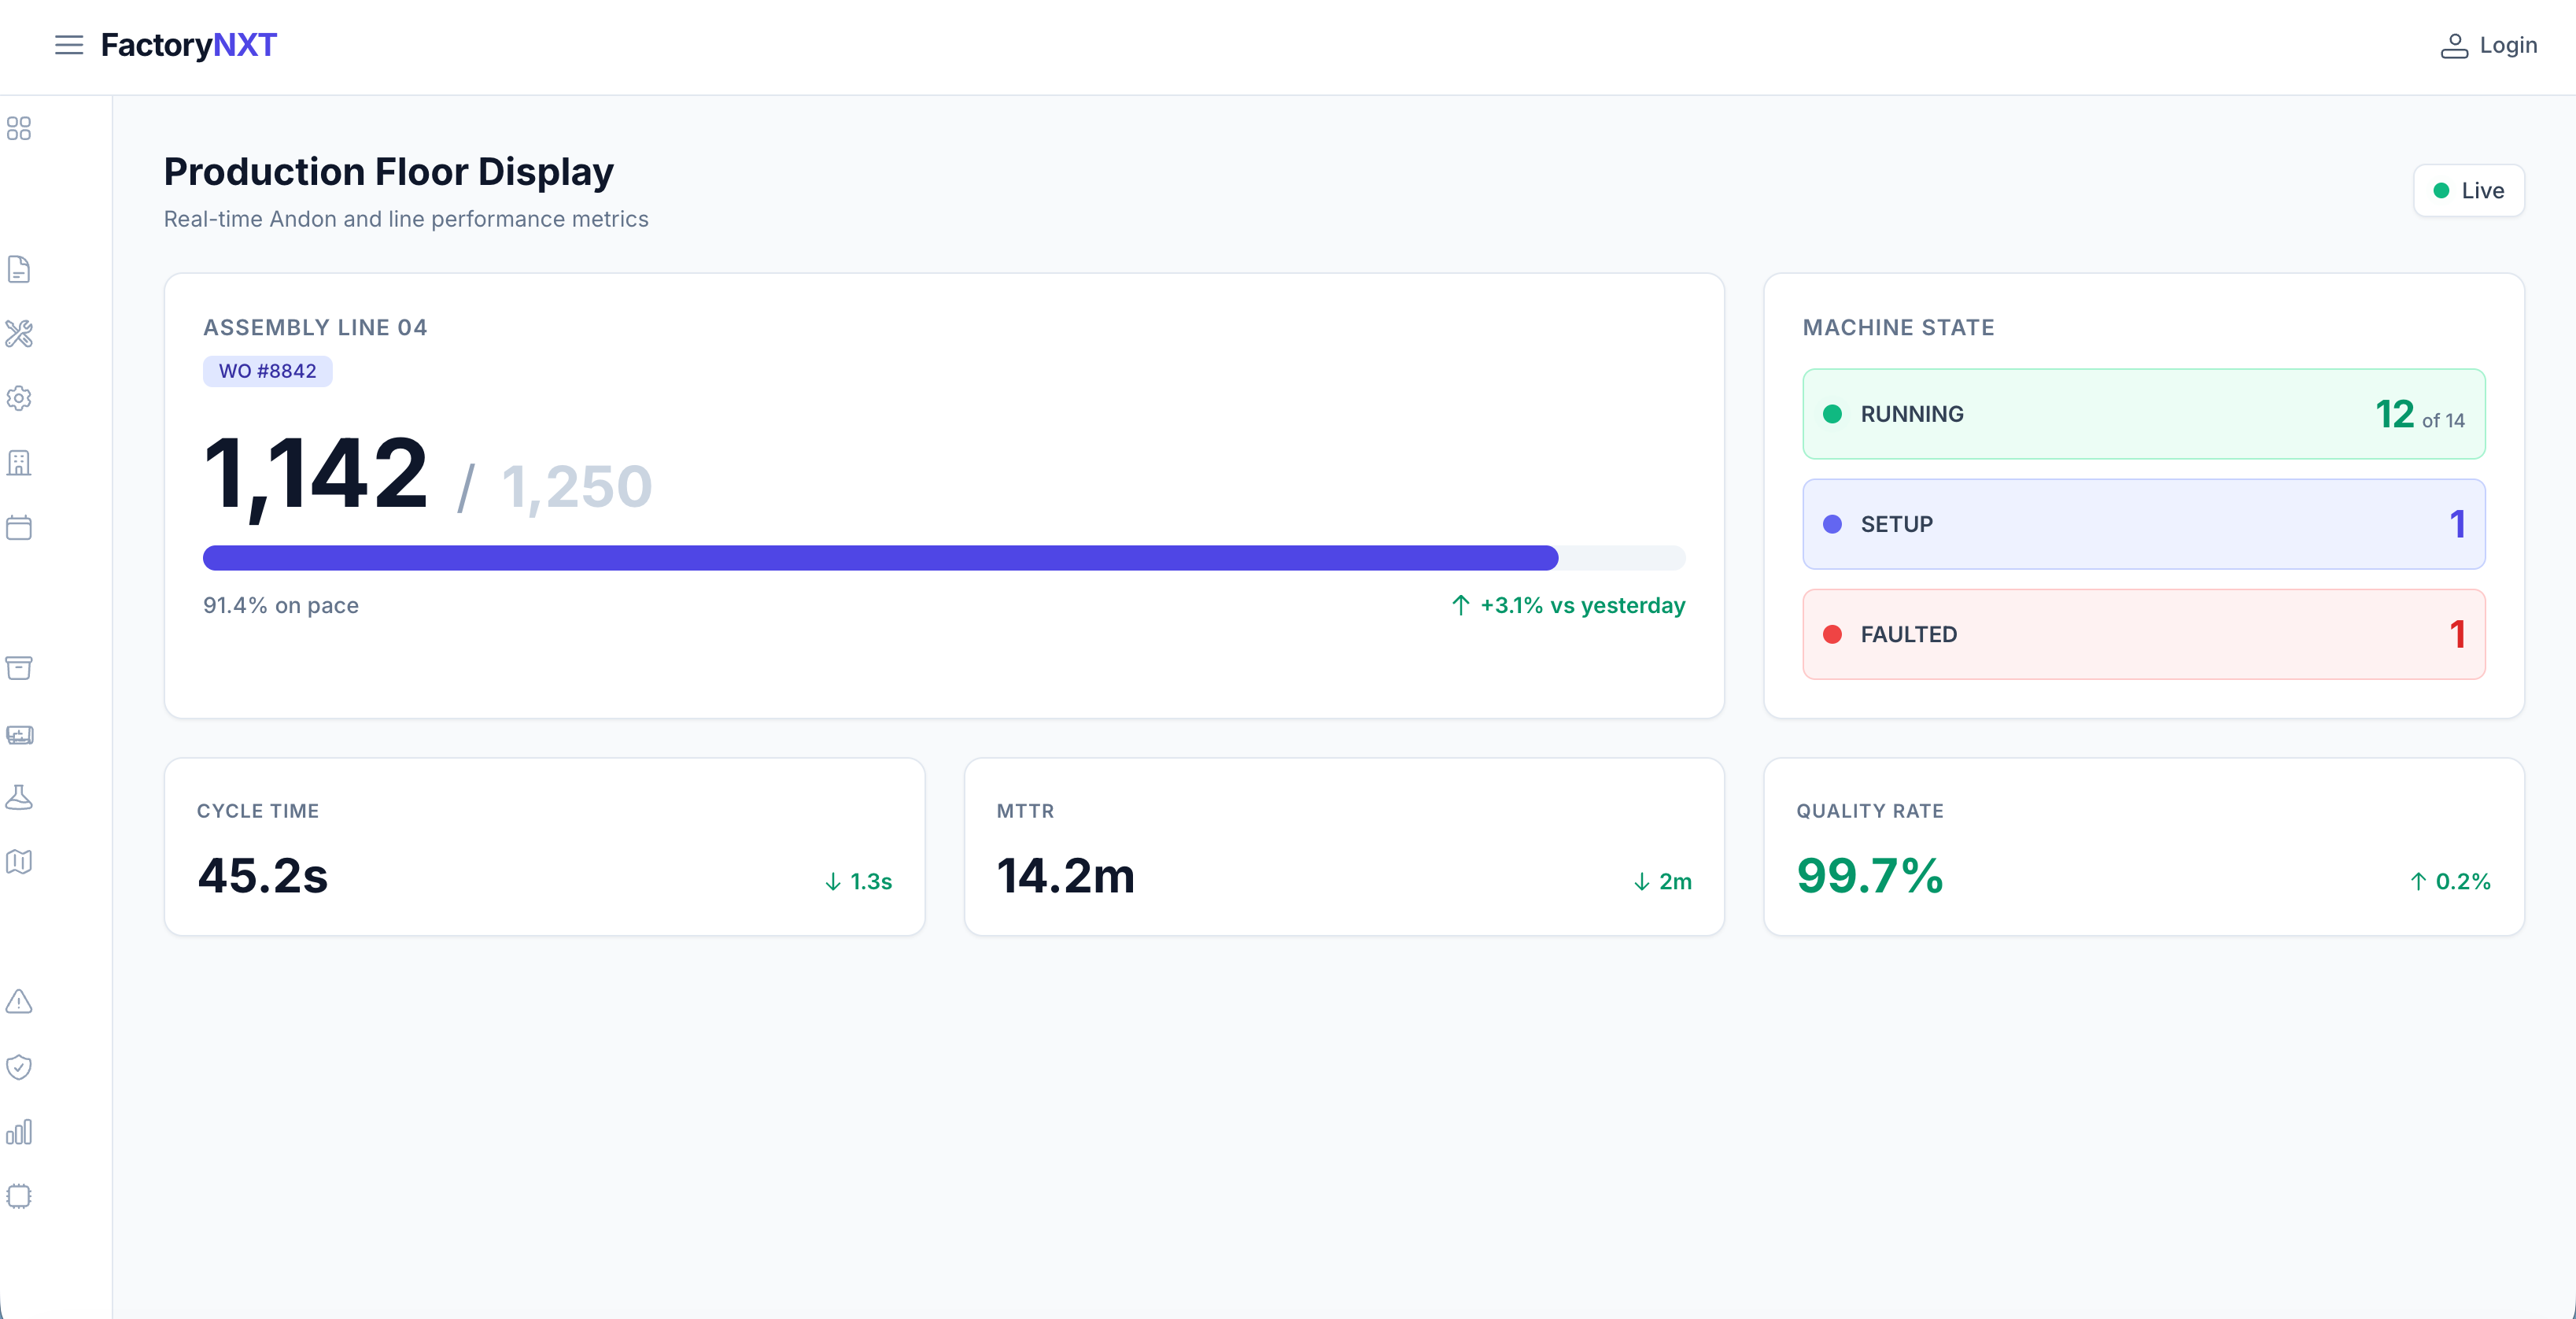
Andon & real-time monitoring
Large-format displays showing real-time target vs. actual output, current cycle time, and active alerts. Configurable per line, role, or shift.
- Sub-second latency updates
- Customizable KPI widgets
- Multi-line aggregation
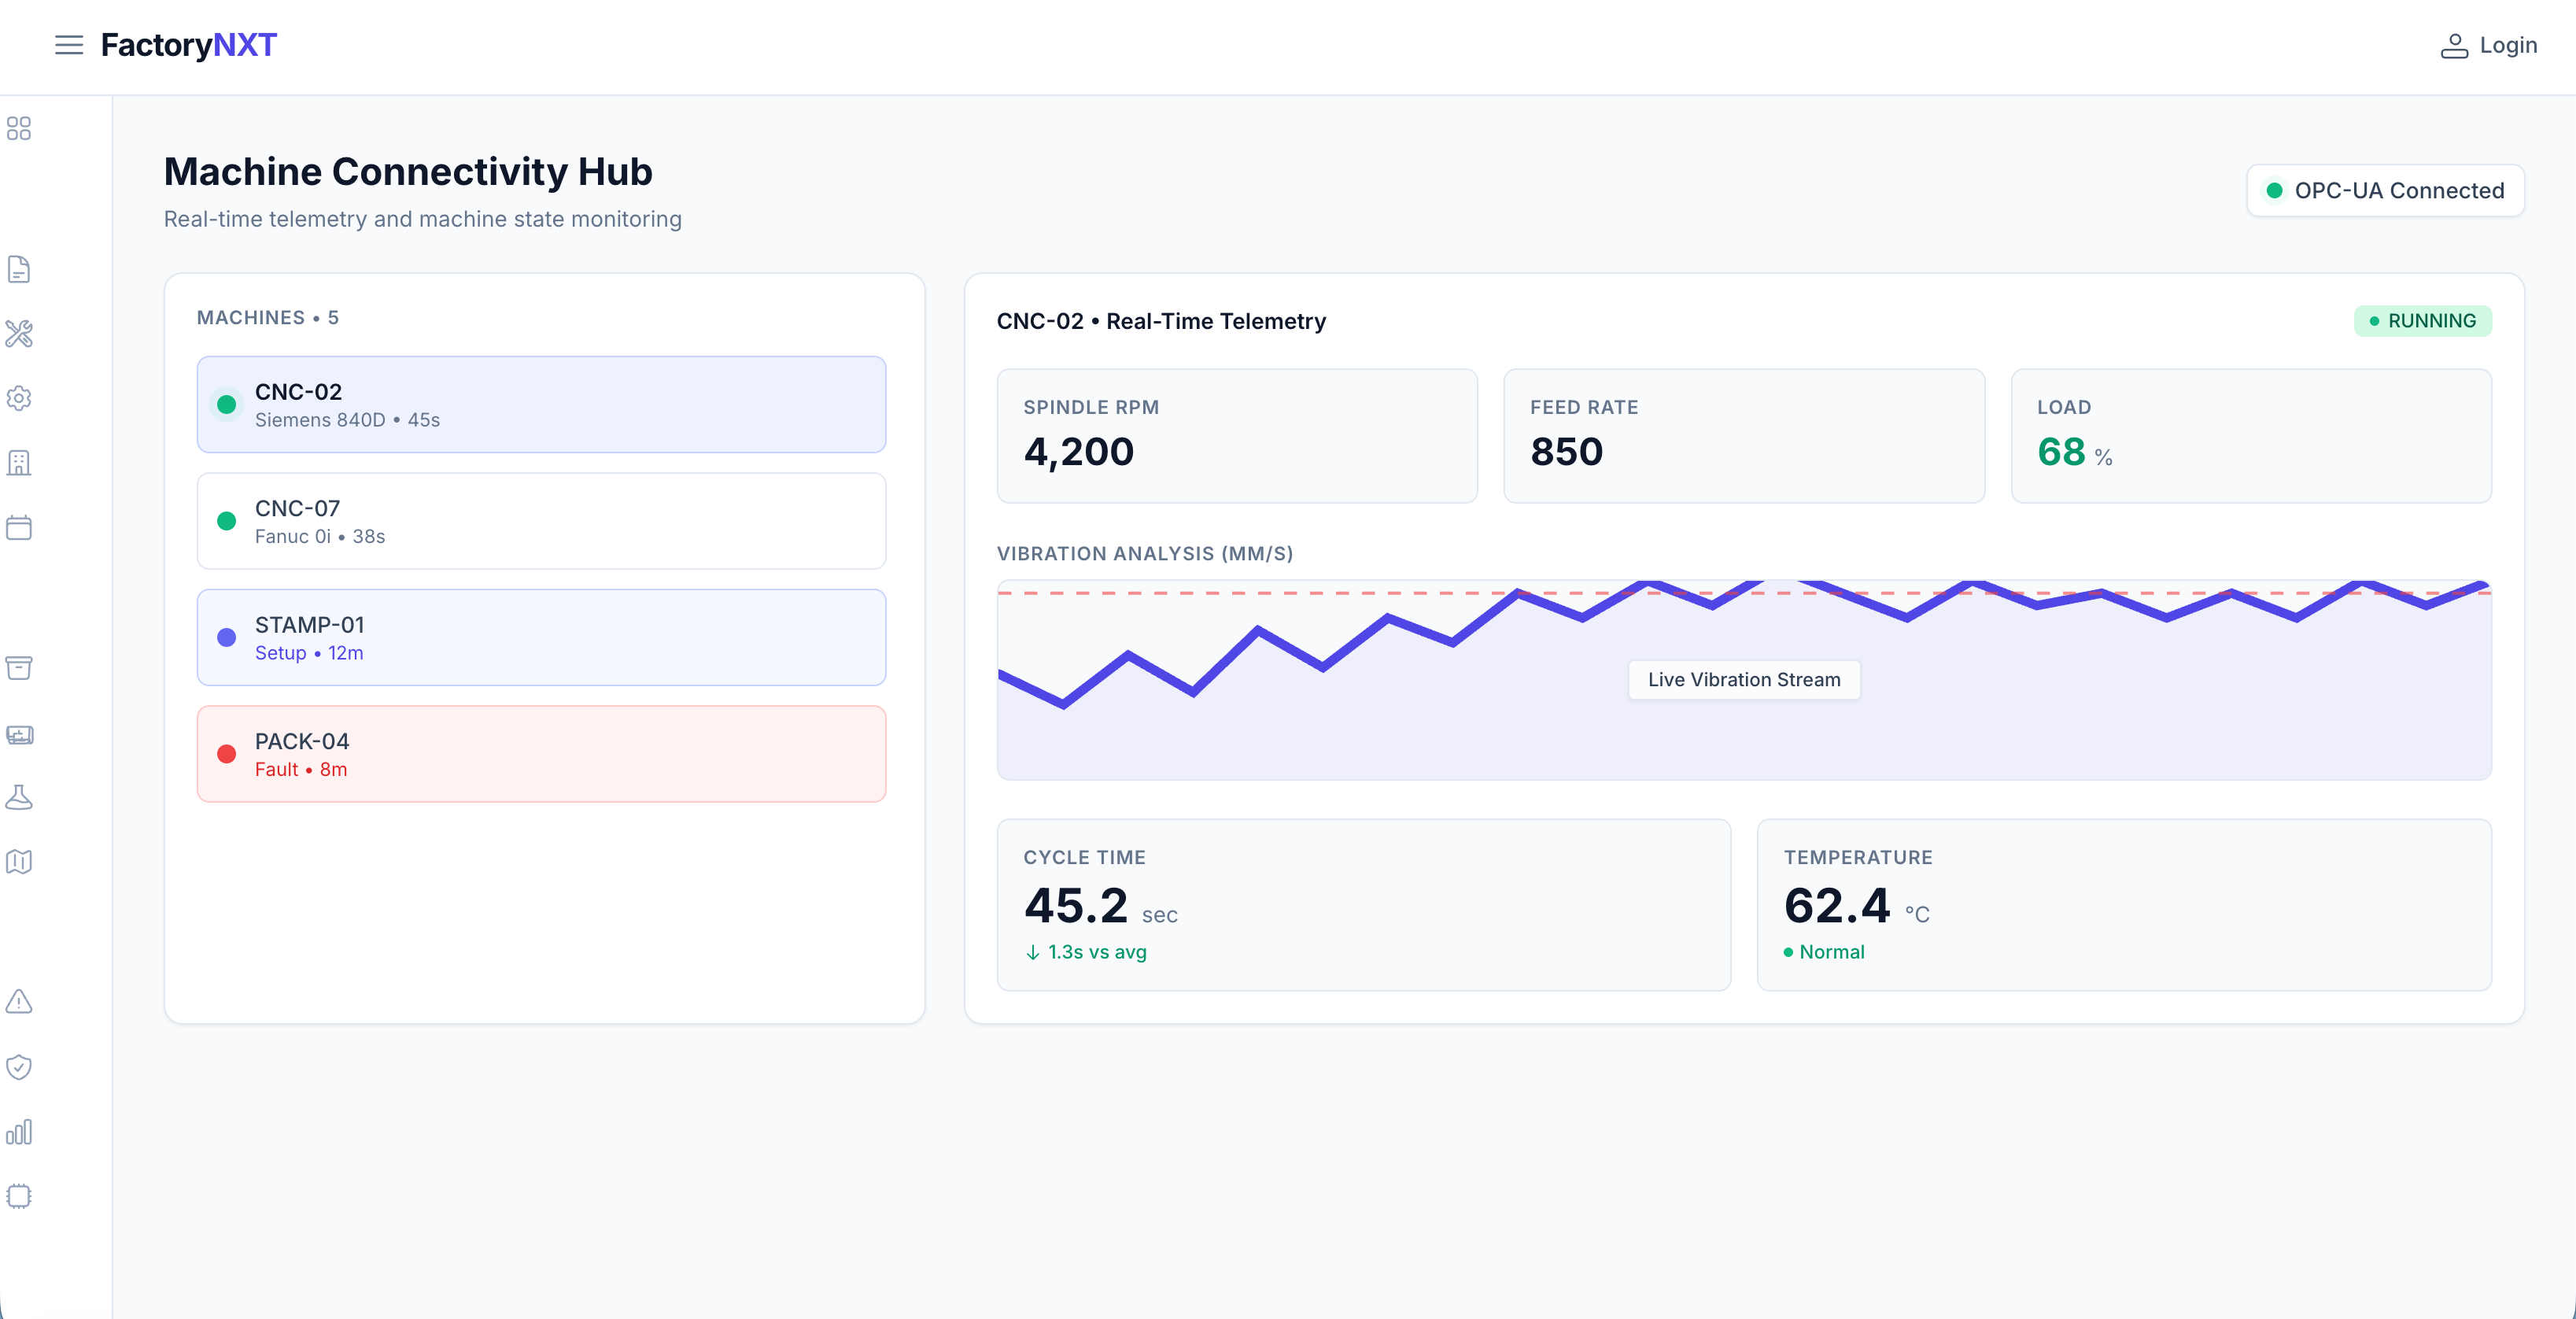
Granular downtime intelligence
Running, idle, faulted, setup — visualized with operator-driven reason codes. Micro-stop detection happens automatically below the threshold.
- Native OPC UA & Ethernet/IP
- Automatic micro-stop detection
- Context-aware reason codes
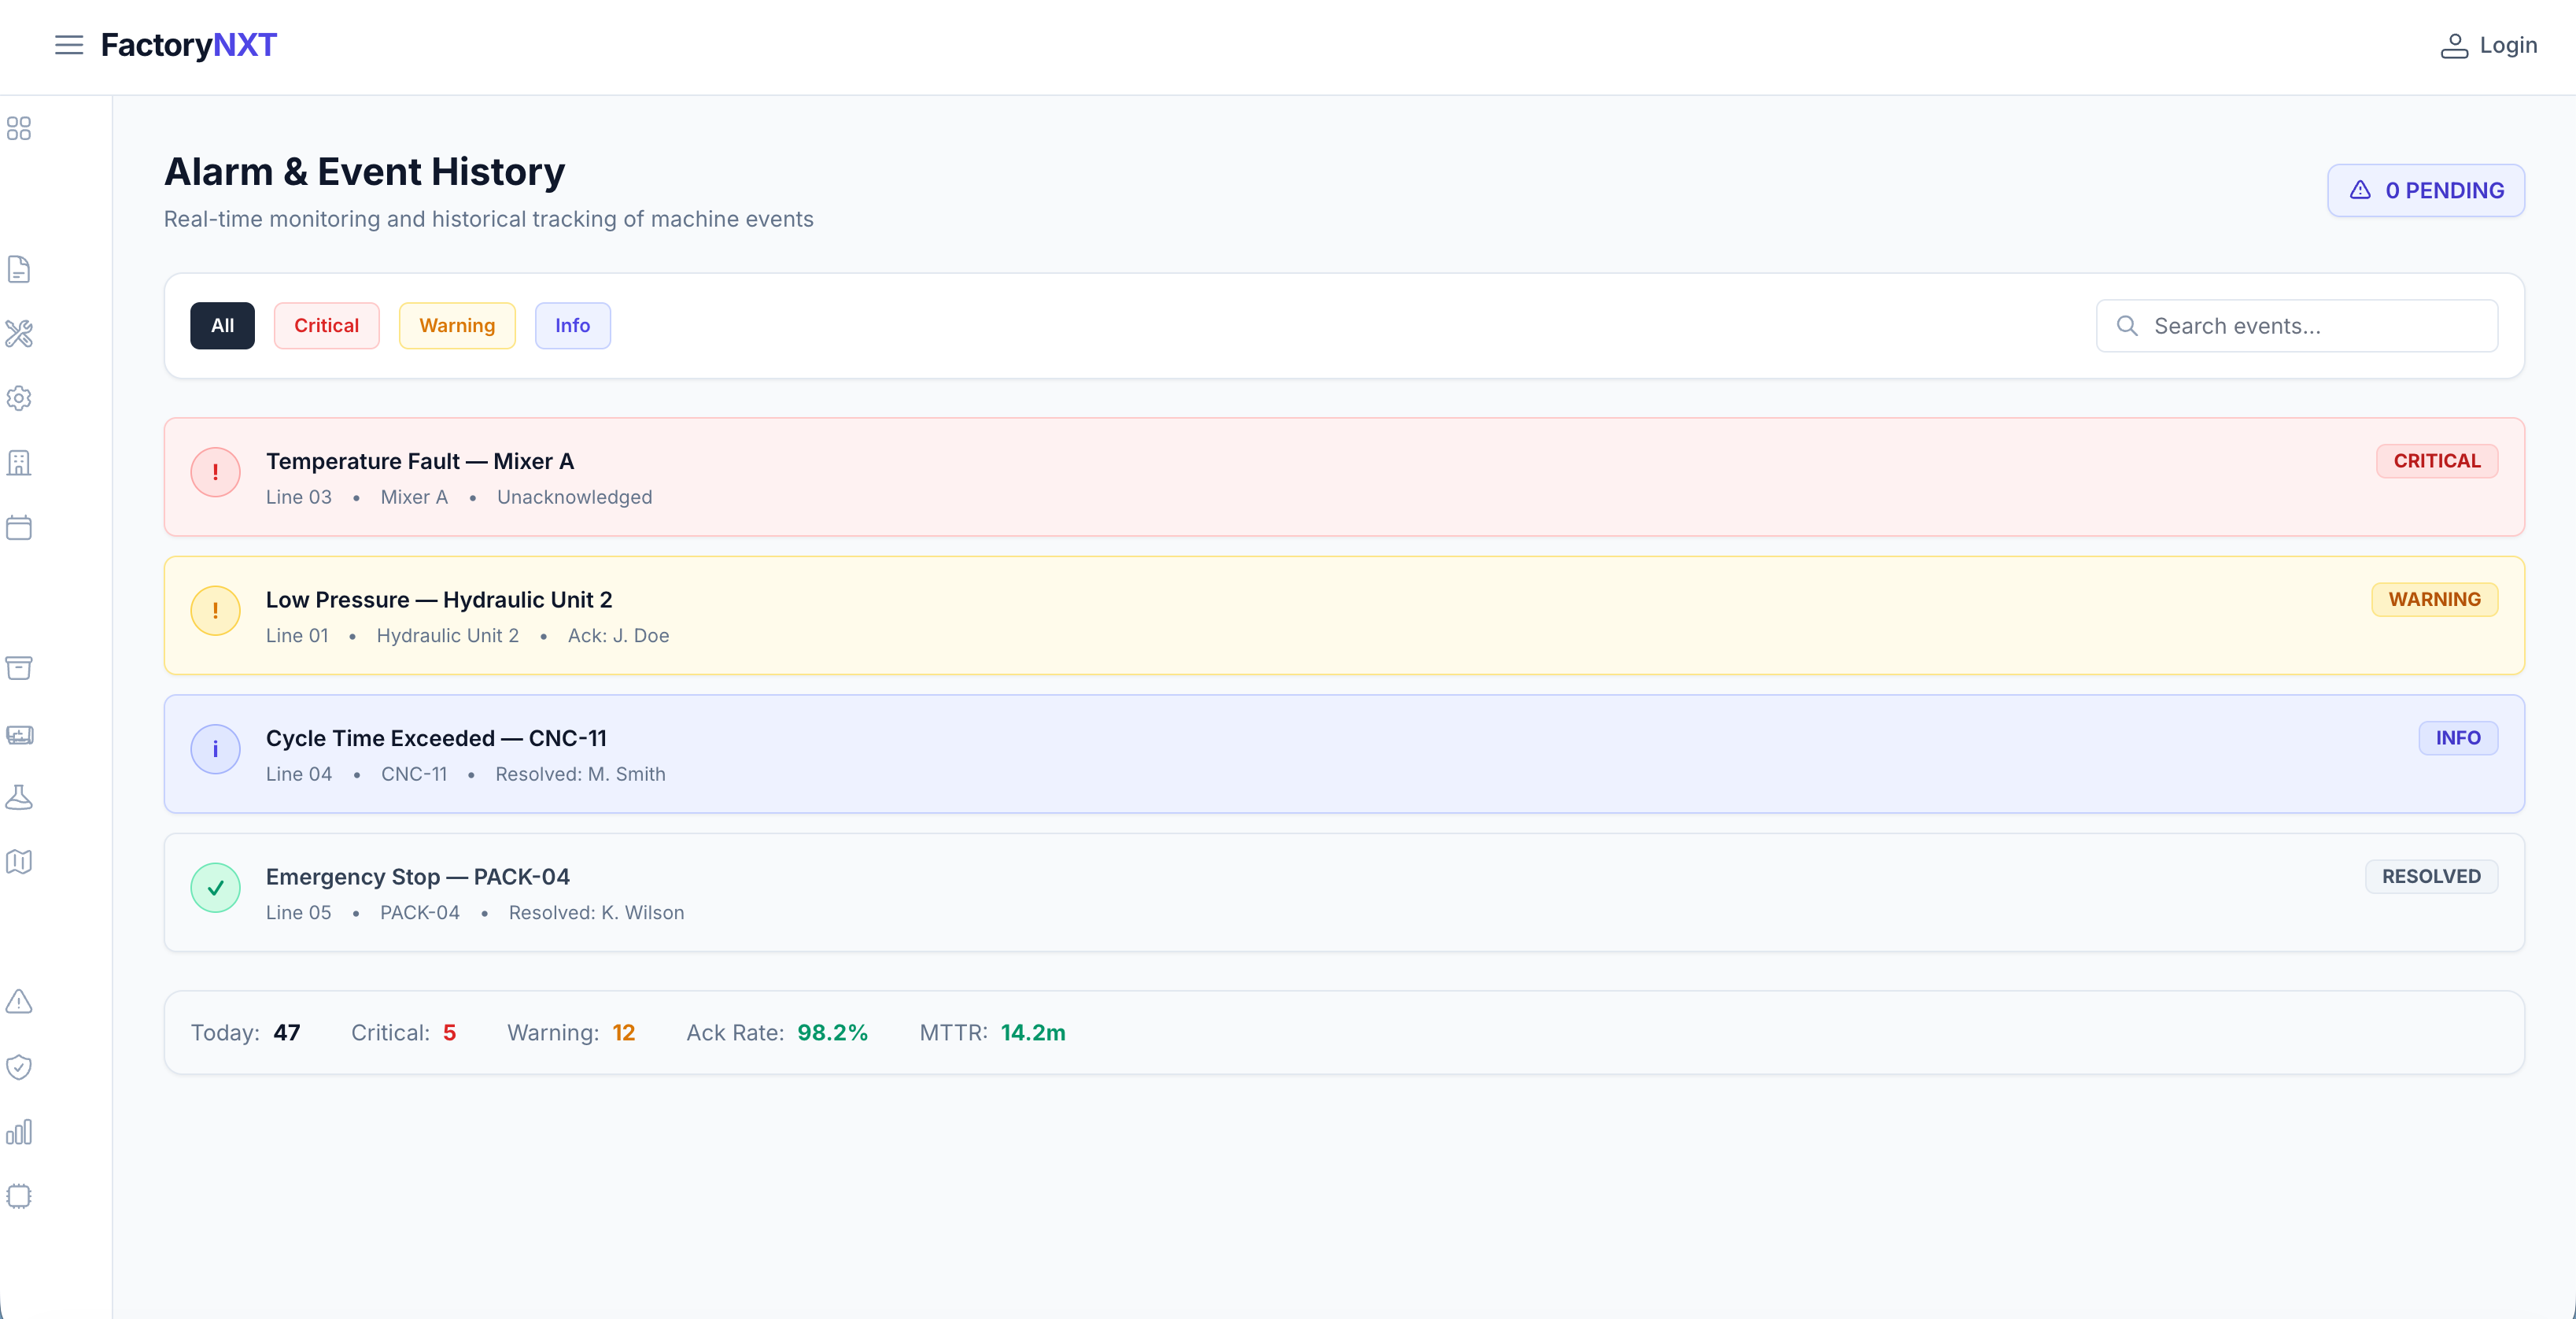
Alarm & event history
Chronological event logs with acknowledgment tracking, escalation rules, and Pareto categorization. Every alarm becomes a learning opportunity.
- Operator acknowledgment SLA
- Severity-based escalation
- Pareto analysis by reason
From sensor to strategy in five steps
One information layer, from the PLC on Line 04 to the plant manager's morning review.
01Connect every machine and system
Pull data from PLCs, SCADA, HMIs, ERP, and MES in their native protocols. FactoryNXT normalizes the chaos into a single, coherent information layer — without replacing what already works.
Connected sourcesPLC42SCADA6ERP2IoT188HMI14Total25202Capture every event, in context
Production cycles, quality reads, material movements, alarms, operator actions — captured with full context. No more "what happened at 14:32?" questions. The timestamp is there, along with machine state, recipe, and lot.
Event pipelineCycle complete — CNC-0214:32:08Quality gate passed14:32:09OEE recalculated14:32:09Lot #8842-A updated14:32:1003Analyze downtime and OEE, live
Automated Pareto analysis of downtime reasons. Correlate micro-stops with specific operators, material lots, or maintenance events — and ship the insight back to the right person.
Downtime paretoMaterial shortage48hTool change33hSetup22hMinor stop14h04Trace every batch and process step
Forward and backward genealogy from raw material lot through finished good. In a regulated plant, this is the difference between a 15-minute targeted recall and a 4-hour panic.
Genealogy graphFINISHEDFG-8842-A ● completeASSEMBLYWO-8842 ● on-lineSUB-BUILDWO-8839RAWLOT-117405Scale from pilot to plant-wide
Start on one line. Prove value. Roll a templated configuration across plants, lines, and shifts. The same data model and UI — one deployment pattern instead of bespoke integrations per site.
Rollout status12 / 24Phase 2 • In progress✓Plant A — 4 lines live6 months✓Plant B — 3 lines live4 months◐Plant C — 2 of 4 linesin progress○Plant D — planned Q3scheduled
Real operations. Measurable impact.
Typical outcomes from customers within the first 6 months of rollout.
Average OEE improvement across deployments
Median reduction in scrap rate
Faster root-cause analysis cycle time
SLA-backed platform availability
A manufacturing platform, not a generic software product
Deep OT/IT fusion
Pre-built adapters for SAP, Oracle, Rockwell, Siemens. Out-of-the-box — not six months of services work.
Fast deployment
Pilot a line in 4-6 weeks. Roll a template to the next plant in 2 weeks. No bespoke work per site.
Secure & scalable
Role-based access, encryption in transit, audit logging, and horizontal scale to multi-plant deployments.
Enterprise support
Dedicated architect, 24/7 critical support, SLA-backed response times, and quarterly business reviews.
Part of your existing industrial ecosystem
Case studies
Proven impact, on the factory floor.
18% OEE improvement in 90 days
Challenge. 12 stamping lines running on manual paper logs. Downtime data unreliable. OEE improvement plans based on gut feel.
Deployment. Automated downtime capture and digital work instructions across all 12 lines in one rollout.
Zero recall exposure via genealogy
Challenge. Mock recalls took 4 hours. Full production lot traceability required manual spreadsheet correlation.
Deployment. Forward/backward genealogy from raw material to finished good. Electronic batch records with immutable audit trail.
42% reduction in scrap rate
Challenge. Rework and scrap from parameter drift on SMT lines. Issues caught after batch completion.
Deployment. In-process SPC and automated parameter validation. Defective runs stopped before they completed.
A rollout plan, not a project plan
Six structured phases. Predictable timing. Minimal disruption to running production.
- 011 — 2 weeks
Discovery & plant mapping
We audit the OT/IT landscape, map data sources, and define KPI targets for the pilot. Most discovery completes in under 10 days.
- 024 — 6 weeks
Pilot deployment
Deploy on one representative line. Validate data accuracy, user adoption, and initial ROI — prove the model before scaling.
- 033 — 5 weeks
Integration & validation
Bi-directional data flows with ERP, QMS, SCADA. IQ/OQ/PQ protocol execution if regulated. Sign-off on every interface.
- 04Per line
Line expansion
Replicate the pilot template across lines in the plant. Train super-users. Localize dashboards and KPIs per role.
- 052 — 3 months
Plant-wide rollout
Cross-plant expansion using the proven template. Centralized governance, localized operation. Multi-site visibility.
- ∞Ongoing
Continuous optimization
Quarterly reviews, new module rollouts, evolving KPIs. The platform grows with your operational maturity.
Ready to connect your factory?
Schedule a technical discovery call. No commitment required — see a demo tailored to your use case.
- A technical discovery call mapping your current state
- Your biggest friction points, discussed with an engineer
- A demo tailored to your lines, systems, and KPIs